But there is much more content, please explore and I hope you find the content that you are looking for. If not, you can always reach out by adding a comment on a post.
In my last article I build a resource focussed report for both Planner, and Planner Premium “plans”. In that article I removed the Roadmap tables, because they didn’t work anymore. But what if you want to report on the new portfolio feature, which is similar in so many ways? Let’s find out together!
I was recently asked how to report on resources in Planner Premium. And this got me thinking, could I do reporting on both planner (only cards and no hours/capacity) and Premium in one go?
Turns out you can, but… it takes some work to get there. Let me show you what to do, and at the end I’ll tell you where to get the template file.
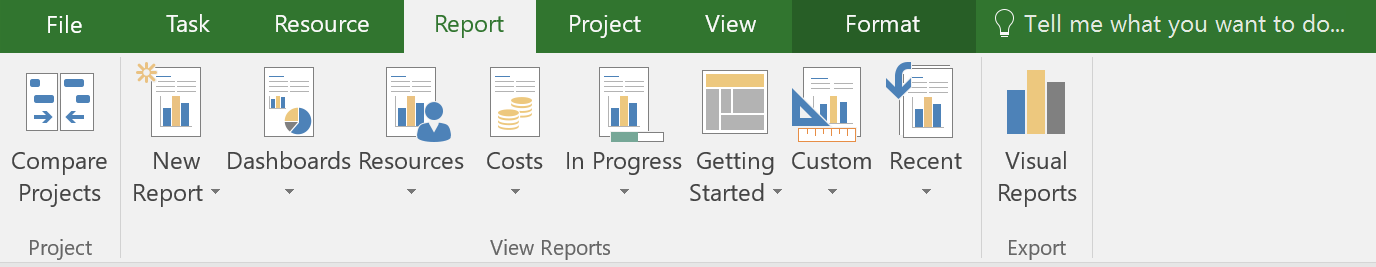
Building clear and readable (Power BI) reports can make a big difference in project success. And, assisting Project Managers in this effort, a Project Management Office might apply Power BI to create these reports and maybe even dashboards.
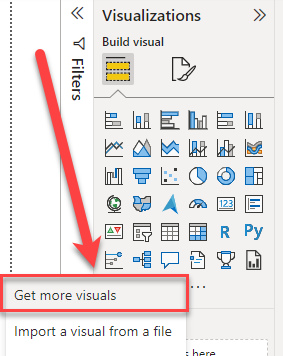
On its own, Power BI is a great tool. But with the addition of custom visuals, it becomes even better.
I have reviewed a large number of visuals on my YouTube Channel, always with the mindset of helping the PMO be successful with Microsoft technology. In this article I’ll discuss 5 custom visuals I believe every PMO should apply. Let’s “get more visuals”!
OKR – The simple idea that drives 10x growth. With a subtitle like that who isn’t interested in reading more, right? Here’s my review on this excellent management book. This post is part of my Book review series, you might like to take a look after reading this one.
Four years ago I published the 3 favorite Microsoft Project reports post. And for the second year in a row it’s the most visited post on TPC. By far! And with two thousand views already this year, I’m expecting another clear winner this year (runner up “About percent complete” is good for almost half that amount of views).
It’s difficult to recreate good “ever green” content, it’s clear that the article has everything people look for. Maybe it’s the list of actions required for a successful report in Microsoft Project. Or maybe it’s because the article describes 3 reports I like the best.
Save to say I wanted to create a follow up article. This time I’m expanding my view to the cloud. More specifically, the Microsoft project management cloud solutions.
Welcome to a first mixed effort for The Project Corner! You might already know I have a YouTube channel, in it I share how to guides and reporting magic. This article is a support article to the video I created recently. In this video I share a “easy” method to create a risk matrix report for Project Online.
Here is the embedded feed for the video:
A prerequisite for this is the Power BI content pack for Project Online. You can find more about this content pack here.
On the 12th of December 2017 I took a deep dive, into “the world of webinars”! Microsoft offered Projectum and myself a platform to talk about our view on Project Management and the tools Microsoft has to offer.
The webinar was a huge success, with 900+ people signing up and 437 people attending the live show. This article is sort of a wrap up and a “More information” kind of post. If you haven’t seen the recording yet: here’s your chance.