Dominic Moss commented on the about baselines post with a nice suggestion. He talks about creating a view that shows a bar that gives the difference between actual finish dates and the proposed finish date captured in baseline(n). I told him that I would consider building this view and posting it on my blog. Today is that day Dominic, and I hope you like what I have done with your suggestion. Let’s build this:
First of all let me explain why the post took so long to complete. I wanted to complete another post first in order to give you more insight about how I create my views within Microsoft Project. And I recently went to the project conference and got married. So without further delay, let’s dive into the Scope Change view building!
I will build this view based on my own methods, but I will also use the consideration Bonny gave on the “Building a view” post. She noted that it would be easier to create the view starting with a view itself. A top down approach, if you will.
The Scope Creep View
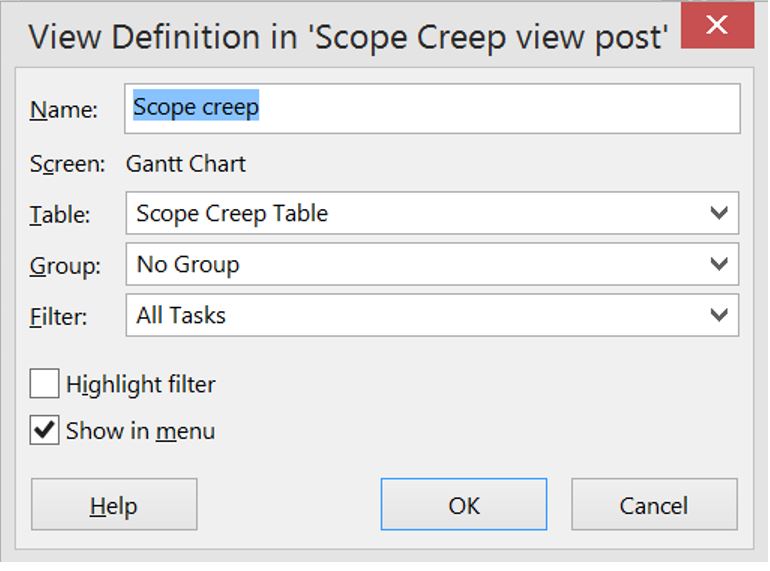
The view I created is called “Scope Creep”. And it contains a Scope Creep table but no filter or group. Here is a picture of the view when I create the Table and view elements.
The fields and table
I will need to build just one custom field. Called “Scope change duration” it is a duration field and has a formula:
ProjDateDiff([Finish];[Baseline Finish])
Of course your scope view will look at baseline data because it needs to have a reference date that it is plotted against. In the above formula I use the date stored in the Baseline (zero) column. Now that we have our fields set up. We can change the content of the table to show for instance: Task name, duration, start, finish and our new Scope change duration.
The bar chart
Here we encounter the major changes. We need to build four new bar styles and change two standard styles. To get the bars that show negative values, when the planned finish date is later then the baselined finish. Or positive, when we have a planned finish earlier then the baselined date.
Changing bar styles is done by right clicking the Gantt diagram part of the view and clicking bar styles. A terrifyingly big and complex menu pops up, bear with me:
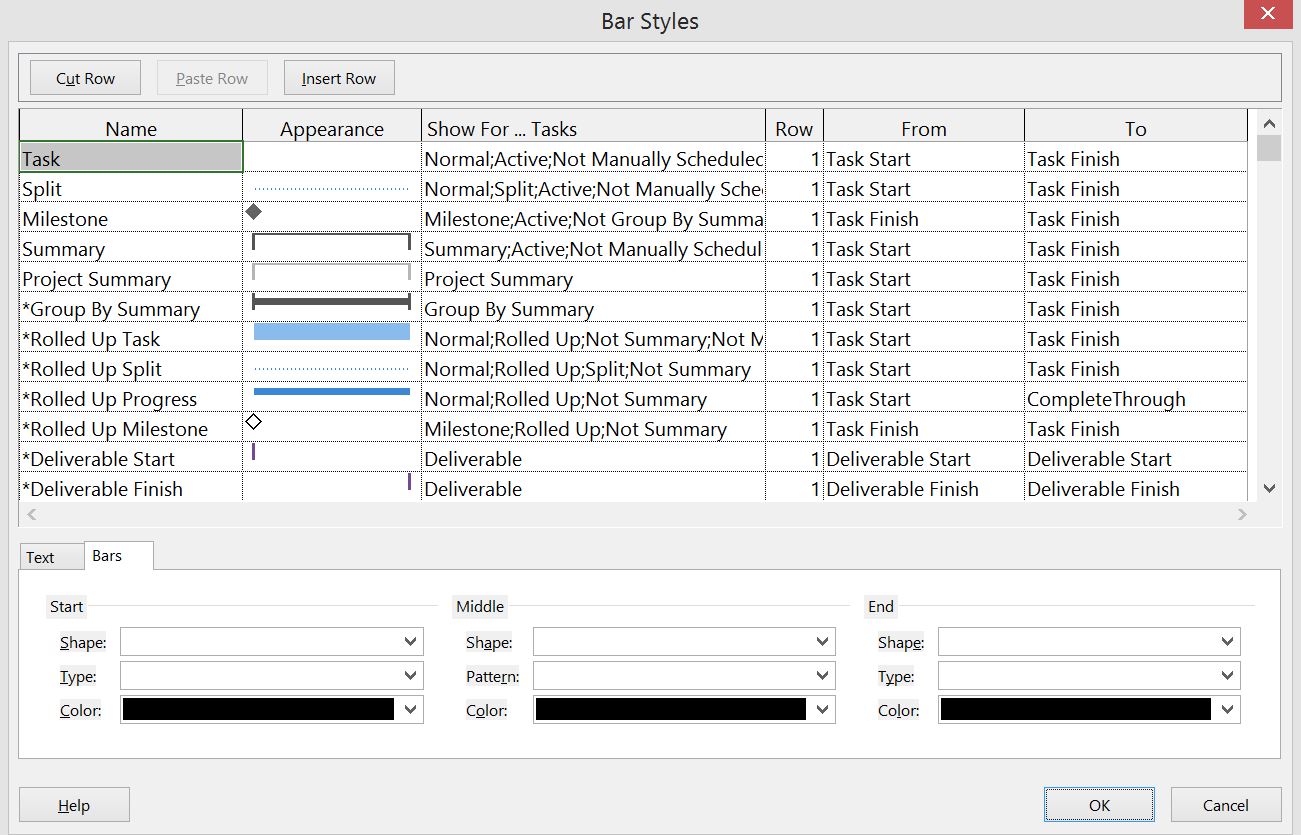
There is a rule within the bar styles menu, you need to be completely aware of what you want to design, and when you want that format to appear. If you insert your own format at the wrong place the result will differ from what you were hoping to accomplish.
Warning! Only do your changes within your own custom view, because getting the basics back can be a hell of a job! So here are the bar styles I created and changed:
- I changed the Task appearance to not show a bar (at the bottom middle shape, change it to show an empty row).
- I also changed the Baseline appearance to not show a bar.
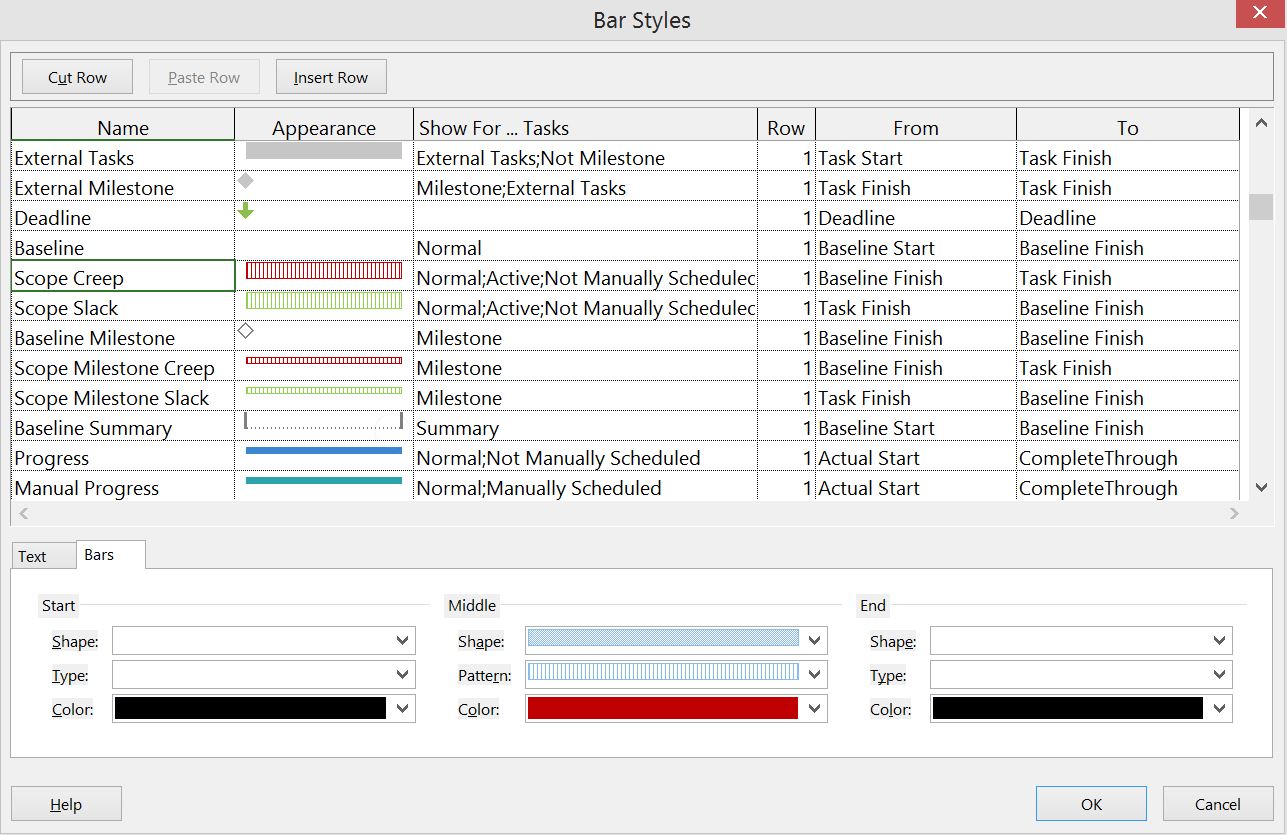
- Below the baseline bar style I inserted a bar called “Scope Creep”. The appearance is a thick bar with a red color and vertical lines. On the column “Show for … Tasks” I inserted this information: “Normal;Active;Not Manually Scheduled”. In From I select “Baseline Finish” in To I select “Task Finish”. After this I changed the tap in the bottom to show text and in the box “Left” I called our new Scope change duration field.
- Below this new style I create the style called “Scope Slack”. This will be the style for a positive creep, I don’t know if Slack is the correct word here, but I liked it :). This will also be a “Normal;Active;Not Manually Scheduled” style but now the color will be green and in From I will select “Task Finish” and To I select “Baseline Finish”. In Text I will add the Scope change duration field to the Right box.
- After the baseline milestone I add two styles relating to milestone creep and slack. The situation is the same as above. Only I change the Middle shape to be a little thinner. And “Show for … Tasks” will just say Milestone. Don’t forget the Text!
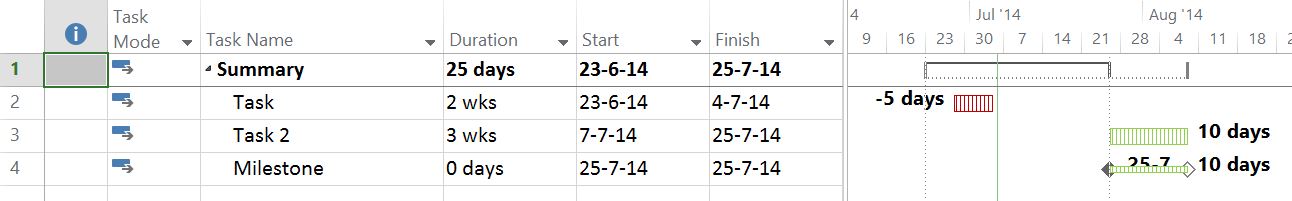
Your Bar styles menu should look a bit like the picture below for a nice Scope Creep View:
Some final notes
With this Scope Creep View in place I can switch between my Gantt chart, tracking Gantt and Scope creep views and have a great overview.
Today I did a view on duration, there can also be fields that show variances between costs. However, these aren’t time phased and therefor cannot be shown as nicely as the duration creep. We could explore this view in a later post I think. Let me know what you think in the comments.
Also, another “quick win” for you: The * symbol in the bar styles menu has a function: it hides styles from the legend in the print view! Took me years to finally find this out, awesome!
If you liked this post, maybe you would like to subscribe to the blog. I promised in my last post that I would send my “The ProjectCornerUI” to any new subscribers. I will not bash your inbox with mails or newsletters, I just have a goal to get 25 subscribers this year haha.
3 thoughts on “Building a scope creep view”
Comments are closed.