As a consultant I travel between lots of companies that use Microsoft Project. Most of the time they use the product as a standalone scheduling tool when I first visit them. The common case is that they have taught themselves how to use the product and most of the time things go relatively smoothly.
This is not the case with views. Views in Microsoft Project are almost always created poorly. This post will be about creating views and about maintaining them properly.
What goes wrong?
Very often a view comes into play on a busy day when you need some columns in a Gantt chart fast and you edit the standard Gantt chart. After a few weeks you will change the view again, just to ad that other important custom field Bob from R&D wanted, that one that describes late progress on a task with a visual effect. And another 4 weeks from then your normal Gantt chart won’t look anything like the standard (you know, the one with: indicator, task mode, task name, duration, start, finish, predecessors and resource names columns). And you don’t know what to do when you want to go back to that essential planners view.
Now let’s look at what a view actually is in Microsoft Project, because it has a lot to offer.
Structure and elements
A Microsoft Project view consists of fields, tables, (optionally filters and groups) a visual part and maybe a split screen or a timeline. And if you want to build a good view you will have to work bottom up! Here is a graphical representation I use in my courses:

Where can I find the elements within Project 2010 and 2013? Here are the locations within the ribbon:
- Custom fields can be built within the group Properties on the Project tab.
- Tables can be build using the More tables… option in the data group on the view tab. You will also find filters and groups here.
- Views can be built by clicking on the More views… button which is under the dropdown menu beneath the Gantt chart button on the Task tab.
Designing a new view
Alright my view will be a simple Gantt chart that is grouped by tasks performed by specific departments, that shows progress on tasks using the %complete field. Sounds nice right? For the example I’ll use the “residential Construction” template available from Office.com.
The fields
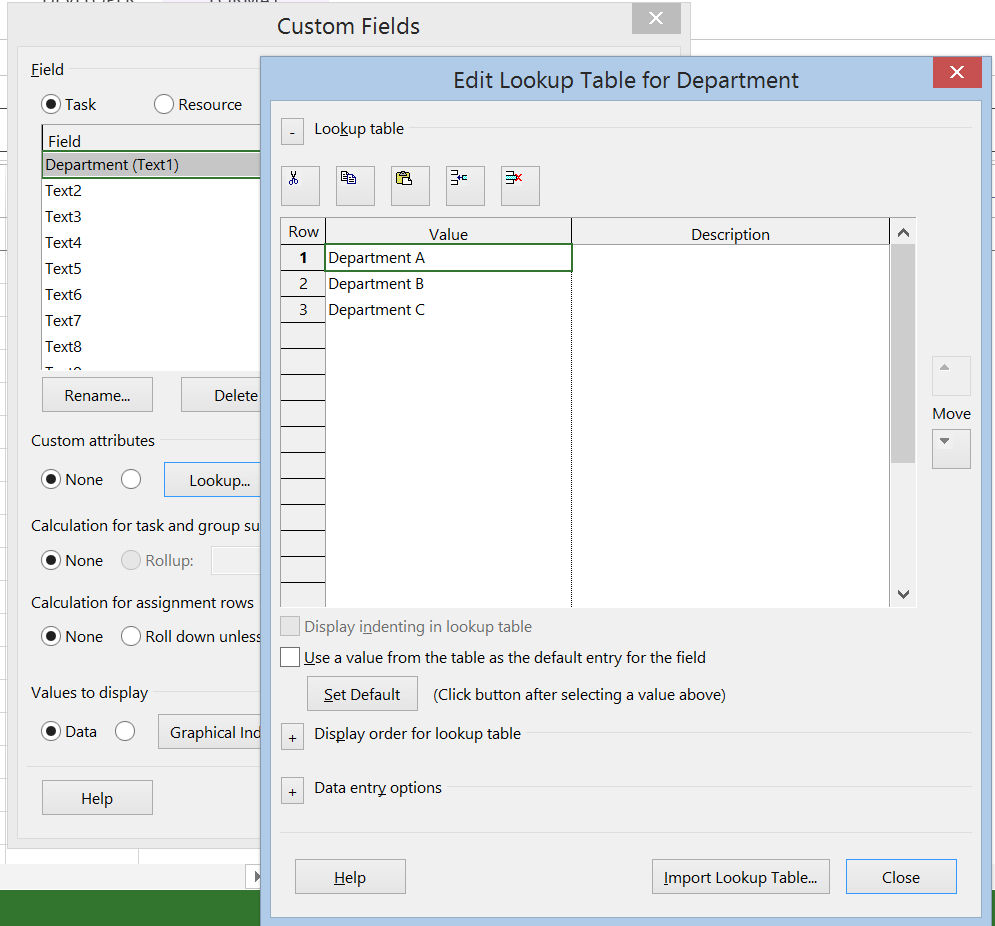
The Department field is a custom text field with a look up table. The rest of my fields are all standard fields that can be found when we construct the table. This is what the department field looks like when I’m done:
The Table
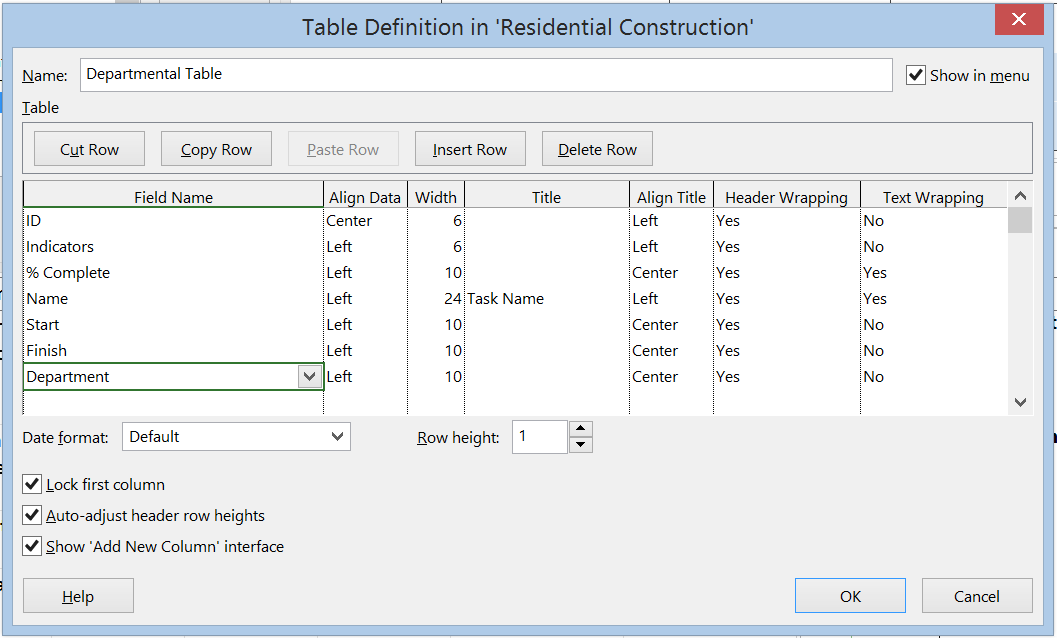
After creating the field I start building the table. I’ll then go to “More tables” and create a copy of the Entry view and call this “Departmental Table”.
Don’t press apply just yet! Just click cancel for now.
Grouping the view
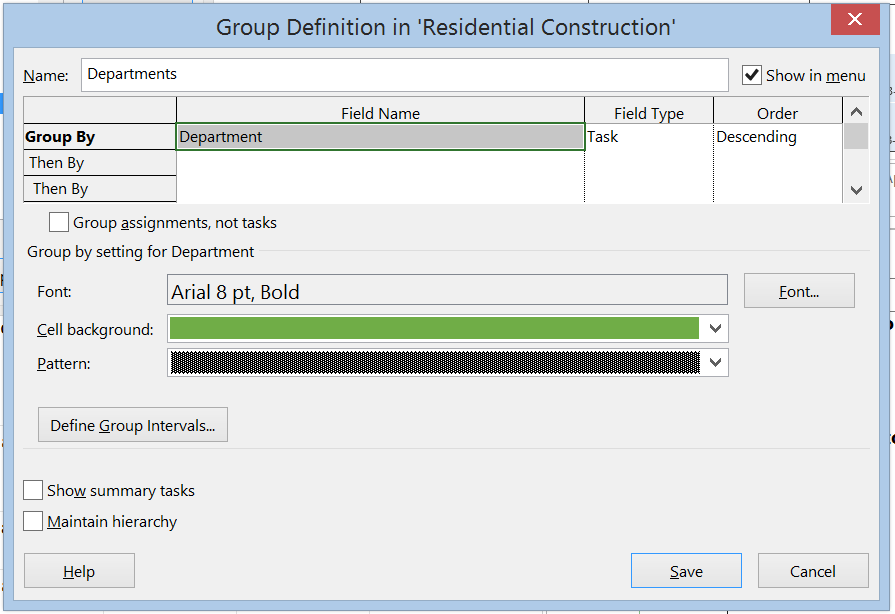
After you have built the fields and the table, go to “More groups” in the same ribbon menu, and create a group that sorts on the departments field we created earlier on. I’ll call this one “Departments”.
Again don’t apply just yet.
And finally the view
When all is done go to “More views” in the tasks ribbon, and create a copy of the Gantt chart and call it “Departmental Gantt chart”.
Now edit the Departmental Gantt chart to include the Departmental Table the departmental group:
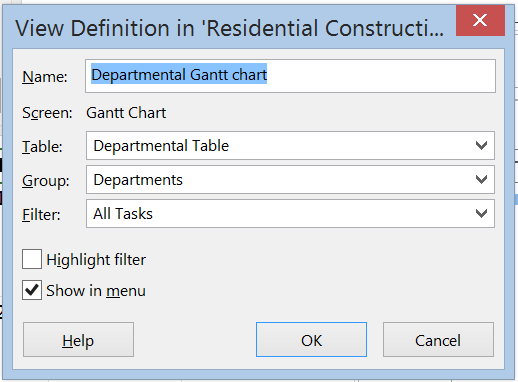
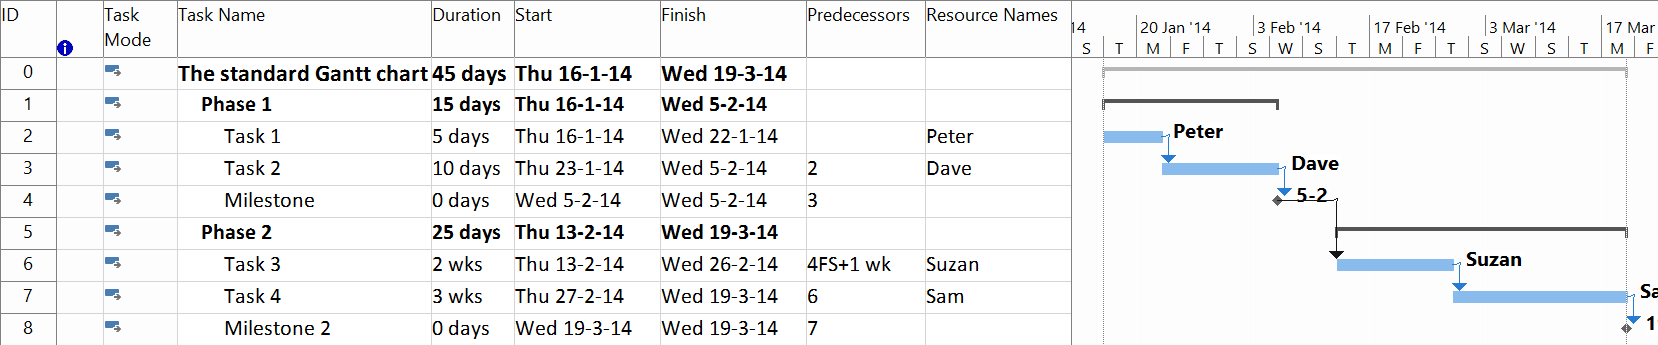
And now you can click Apply :-). Here’s what it looks like when you are done:
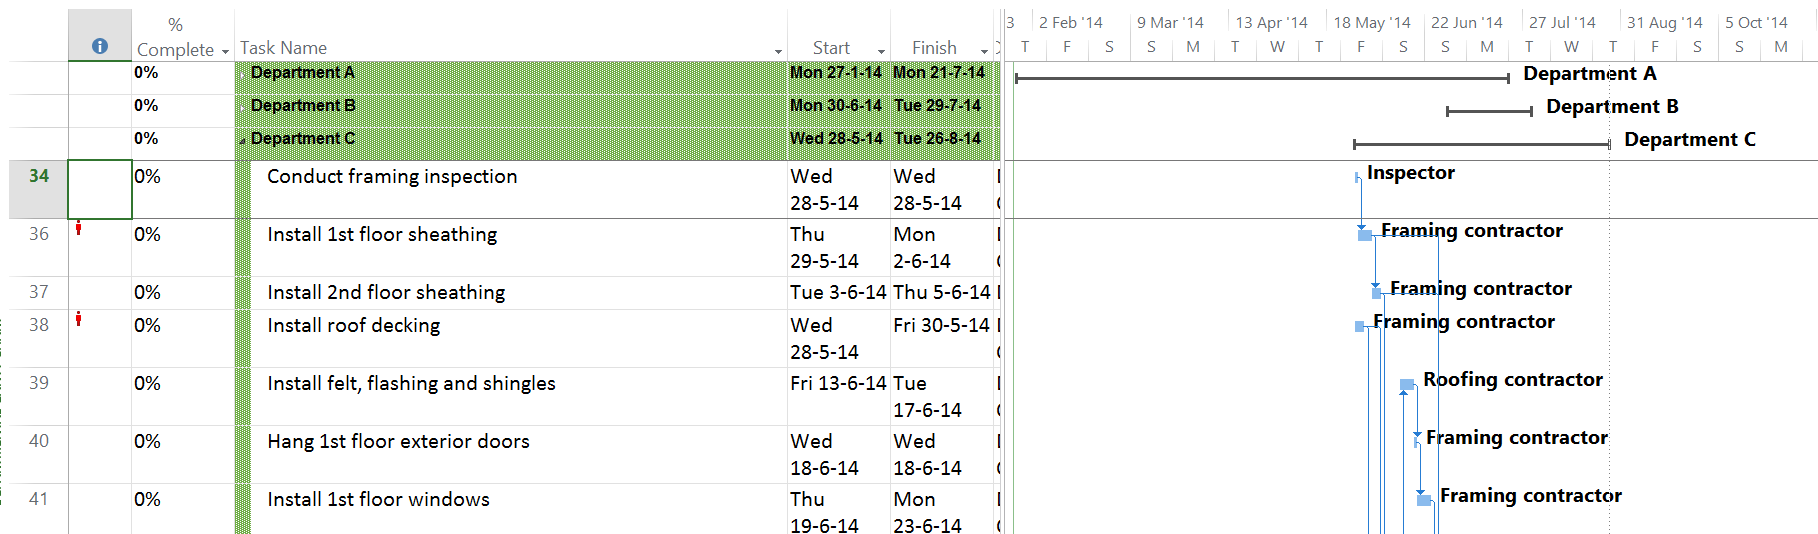
That looks great doesn’t it? And now you can easily switch between the original Gantt and the new Departmental Gantt. And if you want to add a new field just edit the “Departmental table”.
And if you want to make a colleague happy with the view, make sure you give him/her all the elements using the “Organizer”. But that is a post for another day.
Final notes
Wow, this has been a huge post. I want to thank you for reading all the way trough. Please let me know if you like to see some other post on a specific subject. Also please let me know if I’m doing anything wrong. Again: thank you for reading and have fun building your views!
Hi Erik,
Nice post. The only thing I would change is that I (and I tell my students to) name all of the elements with the same name and then it is really easy to know they belong together. The consistency helps:
Field = Department
Table = Department (instead of Departmental Table since it is obviously a table)
Group = Department (instead of Departments)
View = Department (although Department Gantt isn’t bad if you are sharing the view and want people to know it is a Gantt chart).
Bridget
Hi Bridget,
Exelent comment, would be a nice way to cluster all information more succesful.
Hi Erik,
it’s very well explained, that’s the I usually build my custom views. The only question I have is about the “Save view” made available in MS Project 2010 : it’s simpler to use, does it work well when you really understand what a custom view is made of ? Do you recommend it ?
Thanks.
Hi Diane, I haven’t used the functionality much yet. Let me get back to you on the answer in a few weeks.
Hi Erik,
I suggest that you start by saving the new view first. That way, you can click Apply as you set up the view components, instead of trying to remember to wait until the end (or accidentally clicking Apply and adding that component to the current view.
A top down aproach… I like it