Hello readers,
Recently I got to be more active on the Linkedin forums, and I came across an interesting post that could use some elaboration. It concerns the Visual Reports within Microsoft Project 2010 and 2013. As a standard, these reports are created using old Excel templates. But what if you want to use some nice new features? You would need to save that sheet and move away from the compatibility mode. In this post I will share the things you can do to create stunning reports.
Update feb 2016 —————
Hi there, I uploaded my own versions of the Excel Reports to TechNet (they are also available from the TPC OneDrive). Here is the link to the gallery:
https://gallery.technet.microsoft.com/An-updated-version-for-the-da120217
—————————————
But first: the issue explained
If you would like to create a Excel report based on your schedule, you would go for the visual reports section in Project. Click on a report such as the cachflow report and you would get a nice chart with a pivot table on the other sheet. However, the report is in compatibility mode, meaning you will not be able to use some of the new features in Excel 2010 or 2013. And that’s a shame, here is how you can find out if you are in a compatibility mode Excel:

At the top of the file you will read the “not very intuitive” name of the file and you will read compatibility mode.
How come these reports are in a compatibility mode? The excel reports that got shipped with Microsoft Project are created in earlier versions of the product, probably to make it as compatible as possible so that even customers that have Excel 2003 are still able to view the reports. But this is pure speculation on my part.
Updating visual reports in MS Project
Now we need to update that Excel sheet because we want to use some sparklines next to our cost related table. First, let’s click on Convert in the backstage of Excel. Next we will select the option Excel template (.XLST) and give the template an appropriate name. Also make sure you note down the location that the template is stored in, if you work on projects with a team you might want this location to be easily accessible to everyone.
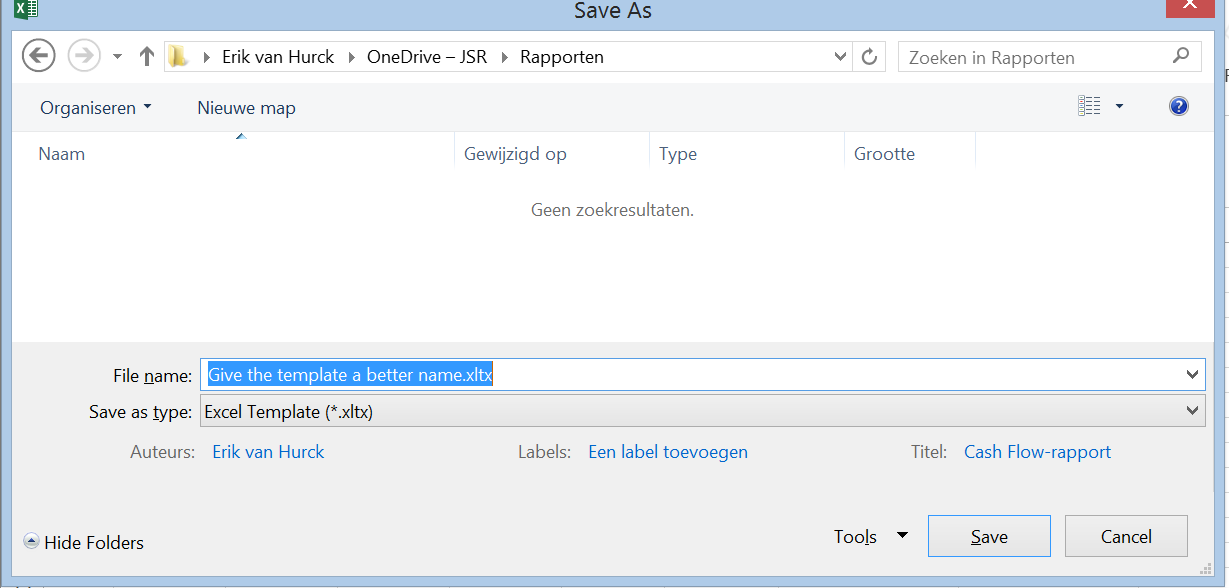
And the final step will be to make sure you search for templates in the new location when creating visual reports in MS Project.
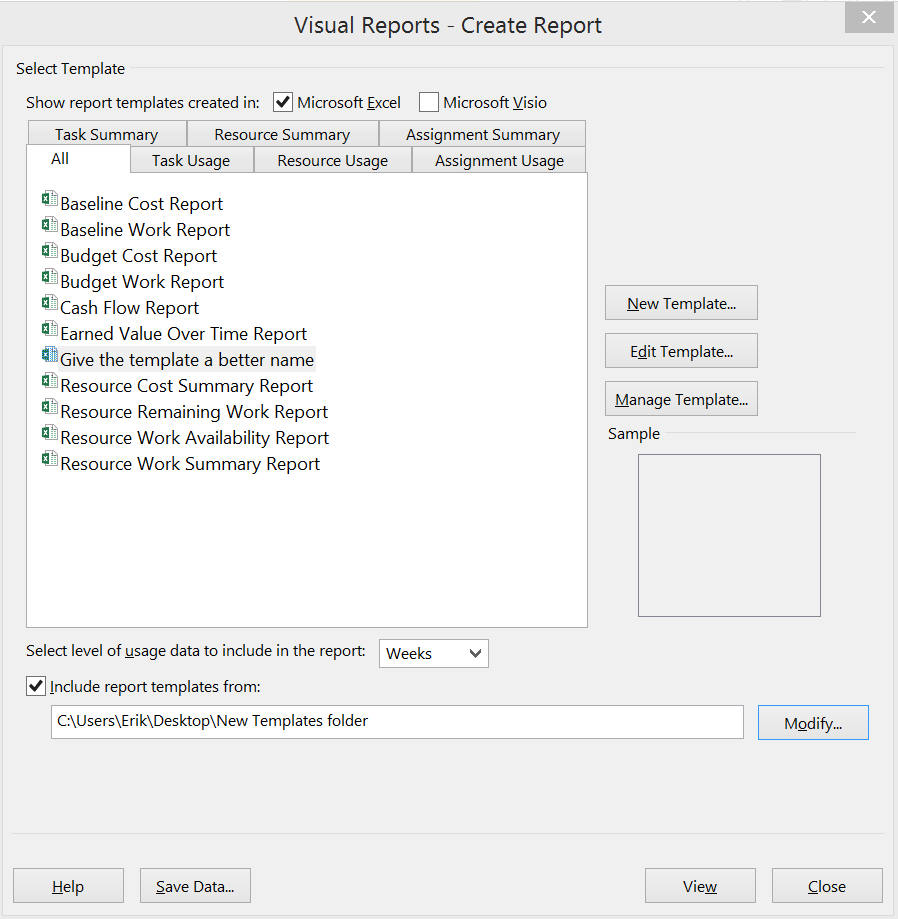
This new report doesn’t have a [compatibility mode] next to the name, and you will be able to use all the rich functionality of the newest version of Excel.
Creating your own visual report templates
Apart from updating your current Excel and Visio report templates you can also create your own. Here is an example I created for a client, it shows overall allocation including the capacity the group of people have:
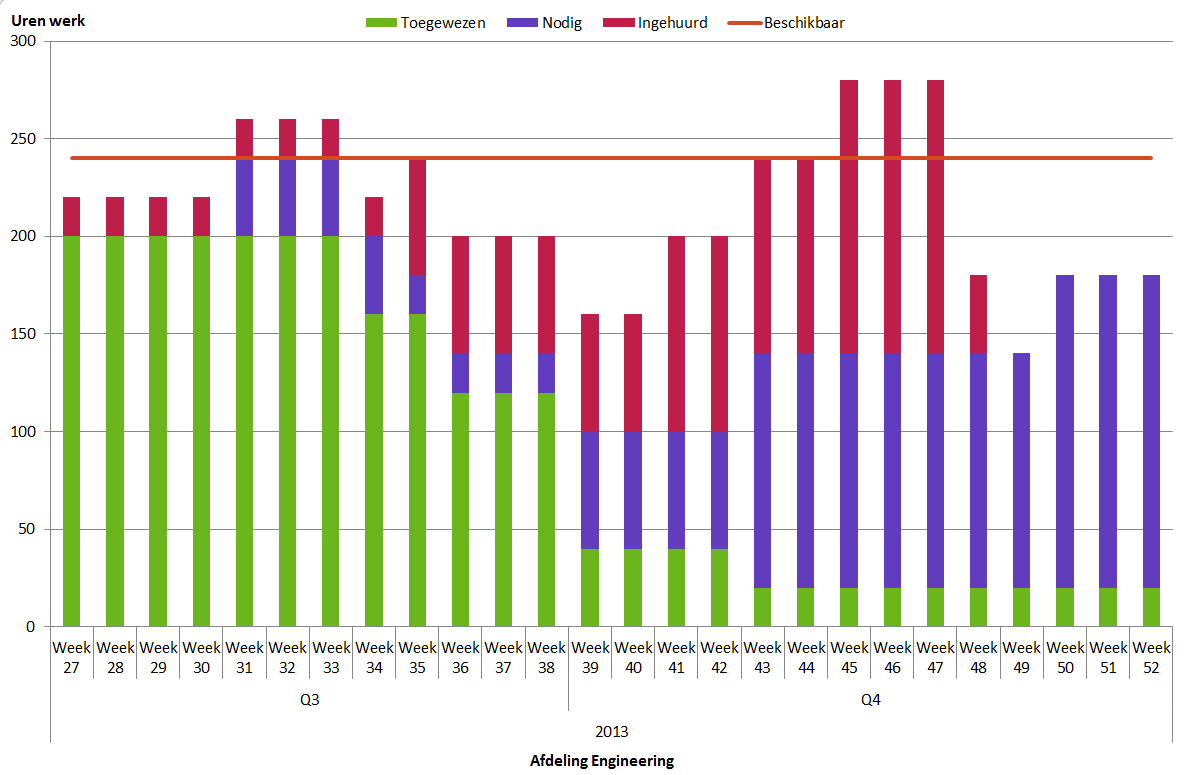
To create reports like this it’s necessary to have some Excel pivot table knowledge as well as a keen understanding as to the fields within Microsoft Project. In the visual reports menu there is a option to create a new template. In the next window you will see the type of program to use for this report, I typically use Excel, a data type relating to the information you want to represent on the template; task related, resource related… And you will also have a field picker to select any custom made field.

Once you have concluded the enty, the application you selected will open and you are ready to create a report yourself :). Once you are satisfied with the results, don’t forget to save the file as a Excel template in the folder you are locating with Microsoft Project.
Two other solutions
The new reports module in MS Project 2013
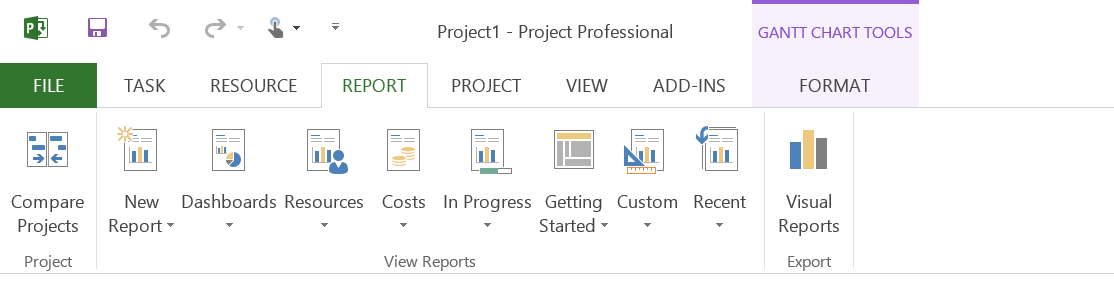
Within the latest version (and if you are reading this in the future, I am relating to Microsoft Project 2013) there is a new rich reporting module that is build within the application. With the new reports it will not be needed to move to another application such as Excel. The new reports are located in the tab called Report:
When you select any of the options you will have the chance to visit “more reports…”, a great starting point to get a clear understanding of the options. I particularly like the “Project overview” report within the Dashboards, because it is usable for any client. And you can even create your own dashboard by selecting and copying items from reports you like and insert them in your own report.
Creating reports using Project Server or Project Online
Ah yes, the Project Server options. Here you have the tools at your command to create company wide reports related to resource capacity by department, team, or skillset. You can analyze financials, view portfolio progress… Everything is at your fingertips. If you are a company admin, SSRS specialist or a report author in the environment that is.
Project Server services reports to the users that were created by certain people in the organisation. you will not be able to easily create a report yourself if you are a project manager. Moreover you would like to rely on the BI guys in your company to service those to you and your colleagues.
The reports will be available from the Reports tab in PWA, here is the default report set:
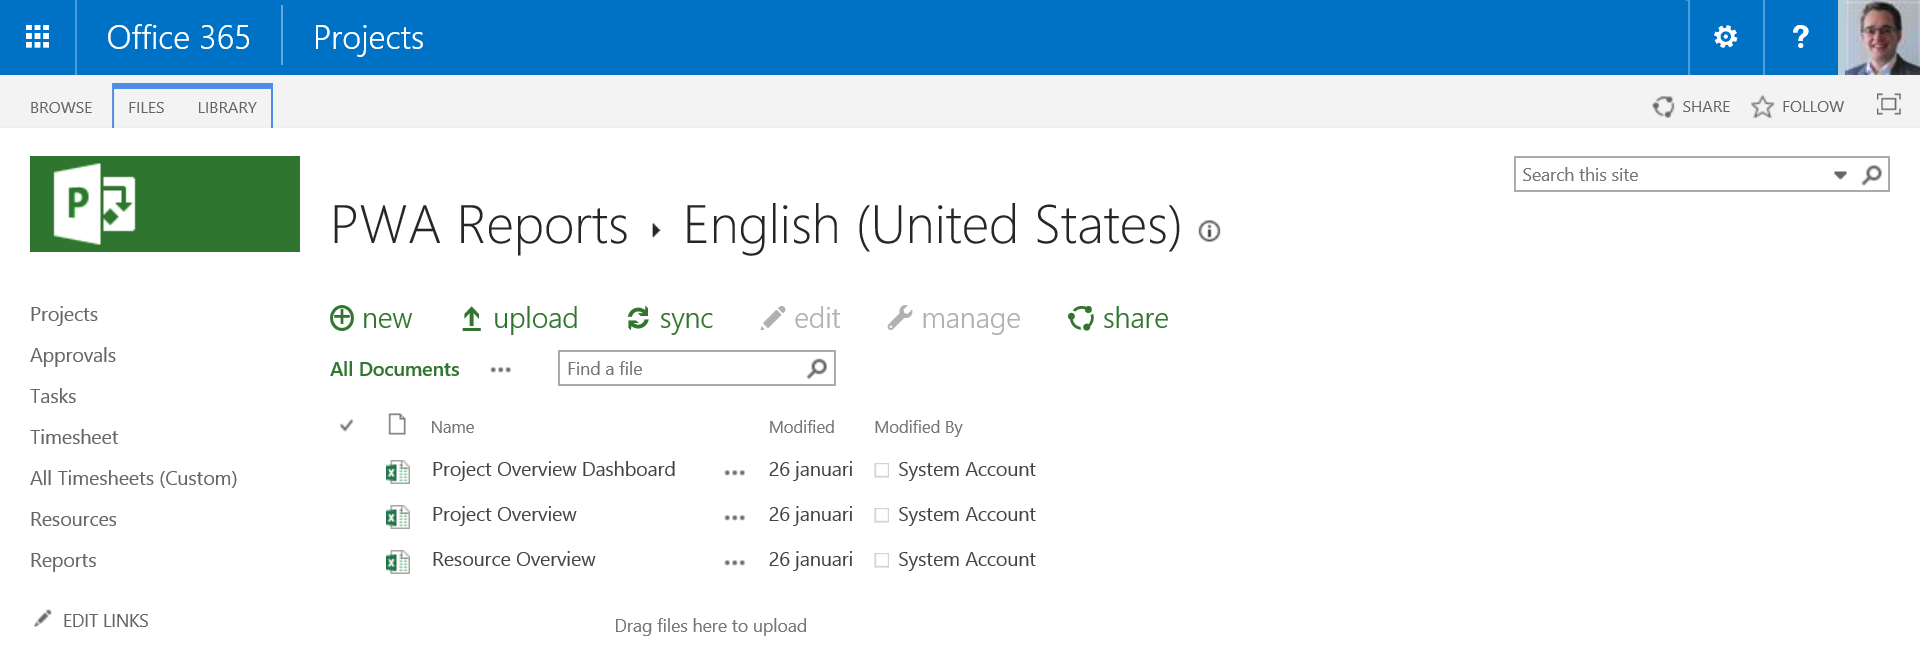
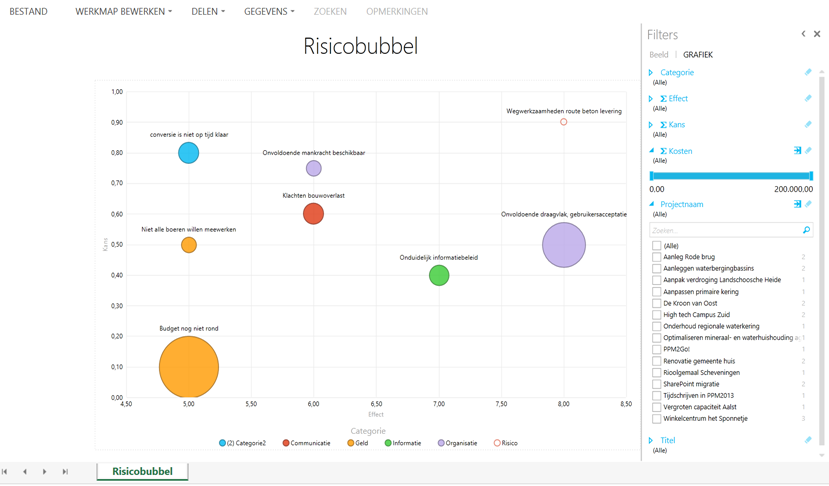
There is a large opportunity to enhance these reports and create new ones. Project Server consultants such as myself create custom reports for clients to ensure the customizations within the tool are also reflected into their reports. A Risk analysis report is such an (Dutch) example:
Final notes on visual reports in MS Project
I believe I got a bit sidetracked in the end. But I hope people will now know how to remove the compatibility mode in their reports :). I might do another report post soon, this was fun! In the mean while, have a look at the Resource page, or maybe a book review for the die hard reader.
And, if you like, you can sign up to the TPC newsletter and get informed about new interesting articles and other things every 1 to 3 months.
Thanks for sticking around, hope to hear from you in the comments.
Hi,
How do you preserve MS Project report formatting?
eg, i have a milestones due list in the project overview report. which i applied formatting to.
if i expand/shrink the gannt chart, the formatting gets lost.
any suggestions perhaps?
Thanks
Sharon
Not sure, but maybe you could save your new report under another name? But let’s see if someone has another nice solution 🙂
How to add text details in MS project report.
Please guide
Hi Sunny, Could you specify the need more detailed? What kind of text value would you need/want and where/how should that be shown?
hi..in MS project 2013 i am not able to open visual reports..it says Excel 2003 required..but we have Excel 2016 installed..
Hi Sudheendra, have you updated the Excel reports like I mentioned in the post and the TPC OneDrive file that is included? This message sounds like you have very old visual reports still related to the project client.
And if that doesn’t help, maybe updating Project to the same version as Excel would work best.
Hope this helps,
Erik