Hello readers,
In this post I will take an extensive look at a set of fields that report progress in the schedule. I will have a close look at the Percentage complete entities within Microsoft Project There are % complete, % work complete fields and then there is also something called Physical % complete. In the field I get asked about the differences between the 3 fields on a regular basis. This post will help clear up some of the confusion, I hope.
March 2016 update ——————
Raphael Santos, Consultant at Sensei Project Solutions, is kind enough to provide a translated version of this post in Portuguese. Here is the link: http://www.raphael-santos.net/2016/03/campos-de-percentual-concluido-do-Microsoft-Project.html.
@Raphael; thanks man!
———————————————
The fields and their Microsoft descriptions
Microsoft has a nice page where all fields are noted down including descriptions on what they do. Here are the entries for the % complete fields: Percent (%) Complete (task field) The % Complete field contains the current status of a task, expressed as the percentage of the task’s duration that has been completed.
Percent (%) Work Complete (task field) The % Work Complete field contains the current status of a task, resource, or assignment, expressed as the percentage of work that has been completed.
Physical Percent (%) Complete (task field) The Physical % Complete field shows an entered percent complete value that can be used as an alternative for calculating budgeted cost of work performed (BCWP).
Oh Microsoft, such sweet words, but now let’s see it in action! I created a project with example tasks to show the changes when progress is made. I use Microsoft Project Professional 2013, but the functionality is the same in older versions.
Percent (%) complete and percent (%) work complete
The simplest version of monitoring progress in a schedule is the percent (%) complete field. Just like the description on the field tells us, it only reports progress on the tasks duration. Here is a reflection of that noted down in a few screenshots:
![]()
![]()
This first on is real simple, I have a task with no assignments on it and no costs associated with it. Nothing going on really, but somehow we will have progress on it :). Now in the second example I have an assignment of 80 hours of work, and the task is a fixed duration task:
![]()
![]() When the progress field is set to 50% both duration progress and work progress is shown. Very nice, but now watch what happens is I work 12 hours a day instead of 8 in the first week:
When the progress field is set to 50% both duration progress and work progress is shown. Very nice, but now watch what happens is I work 12 hours a day instead of 8 in the first week:
![]()
![]()
Wow! What happened? Clearly the percent (%) complete field doesn’t show everything that is actually happening here. I did 75% of the work already, and progress just shows 50% complete. That is because I am looking at a field that just shows me progress in duration. The percent (%) complete field doesn’t cut it.
Let’s have a look at the same example, but now with the field percent (%) work complete:

The above example is relatively easy to read because it is a fixed duration task. Fixed work or Fixed units will show interesting, and more complex, results.
Look at the example below and see if you can figure out what happened with the percent (%) complete field:


In this task I have 80 hours of work to do in 2 weeks. However I decide to work 12 hours straight every day in the first week (I’m just that kind of guy). When the task is a fixed work task, Microsoft Project 2013 (and any version before this one) will look at the remaining amount of work and figures out in what amount of time (duration) I can do that work. Resulting in a duration cut by half a week.
For the percent (%) work complete field this means: 80h = 100%, 20h remaining = 25% therefore: 60h of actual work result in 75% complete. For the percent (%) complete field however: 2 weeks was 100% but now 1,5 weeks is 100%. And because I have already completed 1 whole week, we can say I did one third of the work. Ergo, 2/3 or 67% complete!
Percentage (%) work complete will report progress on the amount of work that was planned, and gives a percentage that might differ from just the progress that is reported on the duration of a task.
Therefore; any project manager that has a schedule that is heavily focused on the amount of work that needs to be done, rather than a focus on the amount of time is takes to be done, should take the field % work complete into account when reporting progress.
Earned value management and Physical % complete
On to the last percent complete value within Microsoft Project. Let’s have a closer look at the description at the start of this post: “an entered percent complete value”.
Let’s put the physical % complete field in all earlier examples and have a look at what progress is shown there:
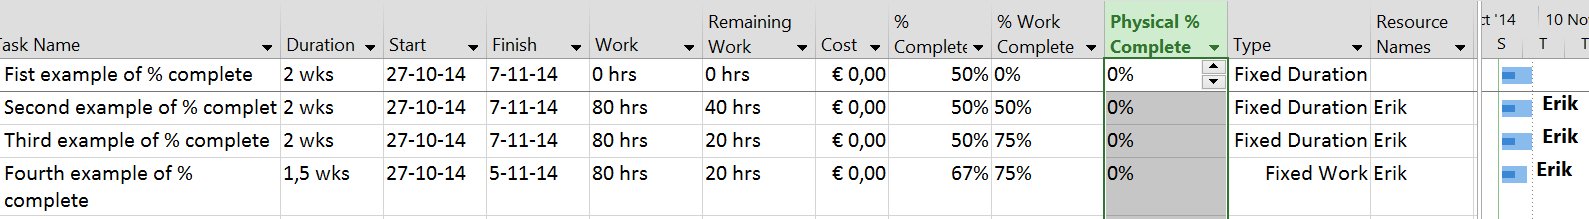
No progress at all. That is because this field is a manually changeable field. Let’s have a look what happens when I set it to 100% for all the fields:
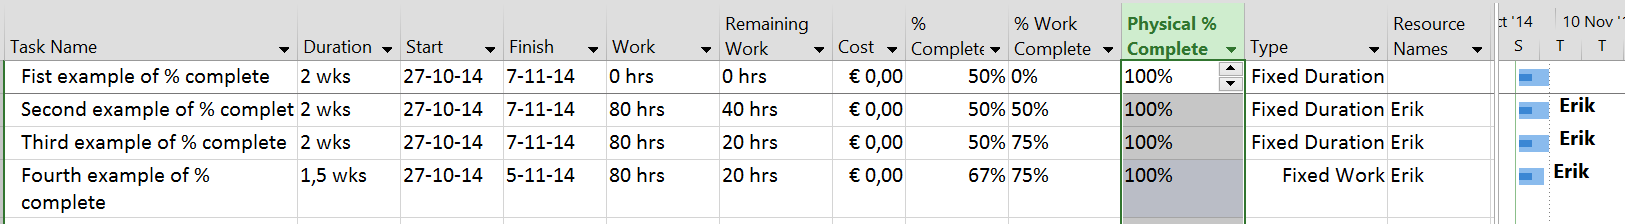
There still is remaining work, % complete and % work complete don’t change and also the graphical part of the tasks still show a little progress bar that relates to % complete.
The “Earned Value method” is a column or option that you would need to set for tasks or the complete schedule in order to get the progress monitored based on this field. You will find the option if you double click on any task:
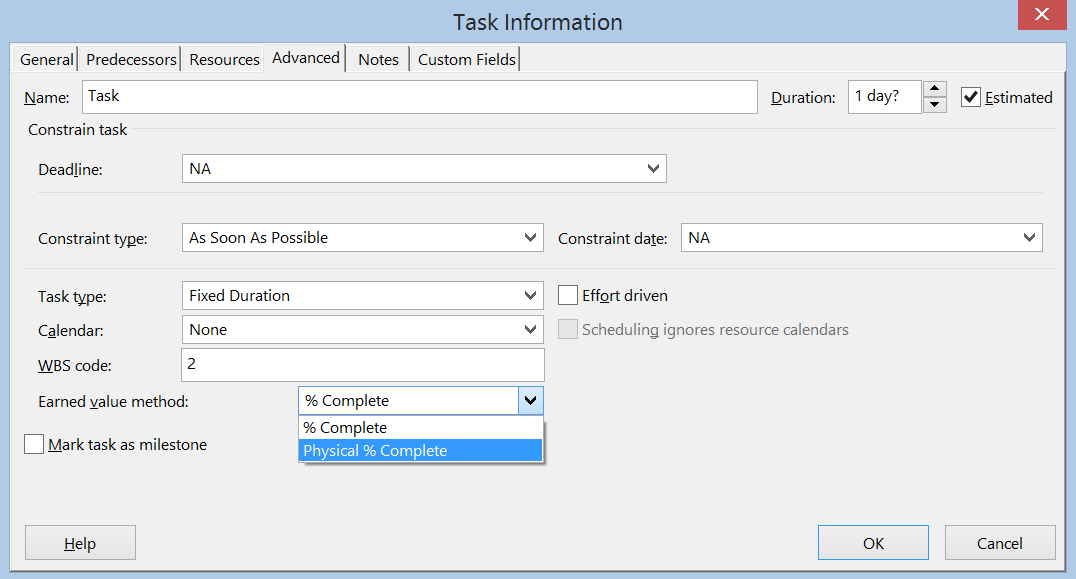
As soon as you set the value to Physical % Complete, there are changes in calculating the value in budgeted cost of work performed (BCWP). And this in turn results in different values in the other Earned Value fields. The following description comes from the Microsoft help file:
“Here’s a simple example of how the % complete values may differ, based on the earned value method you use. Say you’re building a stone wall that consists of 100 stones stacked in 5 rows.
You lay the first row of 20 stones in 20 minutes. However, the second row takes you 25 minutes because you have to lift the stones up one row higher. The third row takes you 30 minutes, the fourth 35 minutes, and the last row takes 40 minutes, for a total of 150 minutes for the project. After completing the third row, you could say that the wall was 60 percent physically complete, because you had laid 60 of 100 stones.
However, in terms of duration, the project was only 50 percent complete because you had only spent 75 of the required 150 minutes. Depending on how you get paid for the work—how the value is earned (by the stone or by the hour)—you may choose the percent complete value or the physical percent complete value to properly reflect this in the earned value analysis.”
Please be sure to know that all other EV fields in Project are still automatically calculated based on values in your schedule. More information about Earned Value Management (EVM) can be found on my post about Earned Value Management.

Behavior in Project Server and Online
The progress fields act just the same with the Project Server and Online versions. So don’t worry, you will not need to learn a new skill set. However, it would be wise to get a company policy in place for progress reports. Is your organization interested in duration progress, work progress or product complete progress? That might be an interesting thing to figure out, and maybe your reports would look a whole lot better and more accurate.
The option to get progress based on what the actual team members report still works based on the settings you have in place. With an added luxury that you do not need to report progress yourself, you just need to check if people actually did what they were supposed to do. And if they didn’t, act on that: Manage by exception! Some things that you could do:
- Reject the task update, and tell the person to report what has actually taken place. Only if you are sure more or less work has been done by the person.
- Locate any deadlines in the schedule to see if you are still meeting demands. Tasks will shift if a person writes more or less hours on a task and that task is a fixed work or fixed units type.
- Get in contact with the person, why did he/she differ from the plan? Can you help him/her in any way? Pick up the phone or maybe you got Lync or Skype, people have never been more reachable then today!
Final notes on Percent complete in Microsoft project
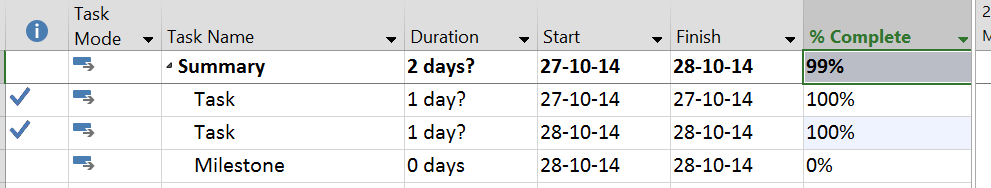
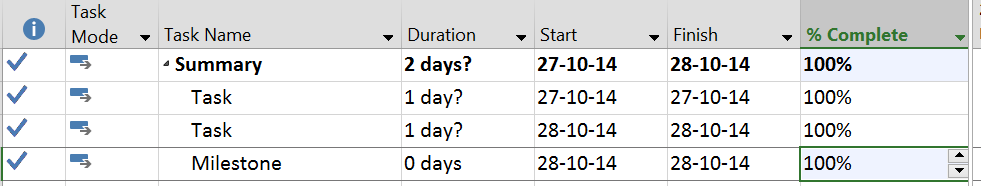
Last thing to take into account: progress is only reported on the selected tasks or their summary task. If you have a summary task with 2 subtasks and a milestone, make sure you set progress on the milestone as well. Or just set the summary task to 100% if you are all done with the tasks. If you do not, the summary will stick with 99% complete.
Thank you all for sticking around till the end. This has been the second “About” post and I had a lot of fun diving into this very specific part of Microsoft Project.
If you are curious about the first post, which is about Baselines, click the link. About posts became a regular feature in TPC, I’ve created a useful combo post that you can find here. Also make sure to check out the redesigned resource page.
And to close this post, be sure to check me out on MPUG. 9 of my articles were featured in the 99 top articles in 2016, very proud! And as always: Thank you all for reading.
Kind regards and till next time,
Erik van Hurck
Great job Erik describing this topic. These issues represent common misunderstandings and what are good options to adress practical questions in managing projects are often seen as too complex. But the fact is that they need to be just as complex as the reality itself in (good) project management. And the trick to make it simple is in the right sequencing of smaller steps. You really shouldn´t ask your team to report progress on tasks before you figure out how you want to value and measure progress in your project.
Thanks for the kind words Alexei, how did you like the book?
The book is a great read. Good inputs and handy advice for every day tasks in project management. Made me change a couple of templates and approaches. Recommend it.
Interesting and useful article – thanks Erik. However, for Example 3, I couldn’t work out how you captured working 12 hours a day in the first week. Please could you explain. Thanks
Elimishia
Hi Elimishia, thank you for the kind words! To get example 3 I use a split screen (Details) view that is focussed on resource usage. With that split screen I add the “actual work” value and put in the values mannually. Does this sound like a solution? If not please let me know and I’ll support the reply with screenshots :).
Thanks for the explanation. In ‘% Complete’, how do I prevent a task’s percentage from changing when I change dates. I want to be able to freely change % Complete and Start and Finish date without the others recalculating. Physical % Complete and % Work Complete allow this flexibility but the percentages don’t sum up to the Summary Tasks.
MS Project 2013
Hi Pete, thank you for the kind reply. As to your question, to my knowledge it is not an option to change the % complete field in the manner you describe. Maybe a custom field will do the trick?
Thanks for the reply, Erik. Is it possible to do with a formula within one field? I want the following attributes:
1. value is percentage
2. value cannot be over 100
3. value roll up to summary row
I played around with some formulas but couldn’t get anything to work. Any ideas?
It would also be okay to use the custom number with rollup (average) if Project would put a “%” after each number.
I believe you can do that with a text field, combining your custom number field with a ” %” value. I’d have to find out how to do this exactly but I will be able to come back to you on that.
to bad the physical % complete doesn’t allow role up I tried but a field with a formula related to the physical % complete also doesn’t allow a role up summary.
Hi Pete and Erik. Maybe i’m not getting the question right, but the fields Physical%Complete and %WorkComplete do rollup to summary tasks. The P%C rolling up is not very precise, but it’s possible to use it. Also it requires some additional settings as Erik mentioned in the article (EV method, positive duration on tasks, work, baseline, etc.).
Alexei, I want to be able to change dates freely without affecting the percentages I have manually entered. So, % Work Complete doesn’t work for me. No matter what I do, I can’t seem to get Physical % Complete to roll up. I tried changing EVM per task and in the whole document Options/Advanced. No luck. Could it be because I don’t have cost data in my project?
Pete, check this out: https://azlav.wordpress.com/2011/09/27/rolling-up-physical-percent-complete/
Great addition to the post Mike, thank you.
Hi Pete, don’t know if its suitable to your specific case, but if you’re talking about fixed work tasks, there won’t be problems in changing dates. It won’t change the %work complete. About the Physical % Complete… yep, it won’t work without costs, or without baseline 0. Maybe you could consider dummy costs (e.g. €1 = 1h). The trick is in the BCWP field. You have to be able to update it by changing the P%C field. The EVM method have to be based on Physical % complete, as you mentioned. The rolling up of the P%C will work and map with the bugdeted cost of work performed (BCWP field). Hope this helps you.
Thanks, Alexei,
But I’m still not getting it. I can’t get %work complete to stop changing when I change the date. Adding costs creates confusion for others using this file with less understanding of Project. I’m just going to use a custom number field that rolls up. Too bad it won’t allow me to make it a % without adding a separate entry field. Kinda frustrating that something so easily done in other gantt programs like Smartsheet can’t be done in Project. Project is perhaps too complex for my needs. I appreciate your and Erik’s help though.
Hi Pete, i have to refer to the first comment to this post, in the sense that “what are good options to adress practical issues are often seen as too complex” . But i agree that it’s not straightforward, and i would enjoy very much to further help you in getting the results you are looking for (they are of course possible). The thing is that whenever you want to work with subtasks and summary tasks (with a wbs structure and not just a shopping list), you’ll have to roll up the % of your progress. And there just has to be a logic under the rolling up method for % progress. In MS Project you can think of duration, work, cost, and you can also be a bit more creative and expand this variables to other uses. I don’t know Smartsheet, but i can’t see functionally how can it work in a different manner. From what i’ve seen i suspect it uses the duration logic. That means that the % progress have to change when you change the dates. If not at the task level, then at the summary task level. Its the same as using % complete in MS Project. If I’m wrong, please tell me. And I’m not defending any PM software over another 🙂 Best of luck.
Hello, with MS Project 2013. We have inserted the BCWP columns and nothing change all is set to zero. The cost values are well defined. By changing the Percent Complete. % of the task, the BCWP dosen’t update values. What is missing ?
Did you set a baseline?
I am not sure. How to set it ?
all simply by this way (below url) the baseline is defined by default on my project : https://support.office.com/en-in/article/Set-and-save-a-baseline-ac855151-34f2-42e8-8b05-c363dced3089
do you know where the probleme is ?
Hi Mathew,
Without a closer look at the issue and the schedule itself it is hard to give a reason why the fields don’t fill. Drop me a line on LinkedIn and we can share e-mail addresses. I’m not promising anything but will take a look at the issue for you
dear Erik
i have two tasks
task start finish BL start BL finish
1). a Jan 1 ’17 Jan 5 ’17 Jan 1 ’17 Jan 5 ’17 0 days 0 days
2). b Jan 7 ’17 Jan 16 ’17 NA NA 0 days 0 days
1st task has general base line and 2nd task has baseline1 .
above shows tracking gantt with variance . but no respond to BL1 in 2nd task as NA . why ms project not respond to 2nd baseline
Hi Nevil,
Thanks for the comment. To be clear, MS Project’s view “Tracking Gantt” looks at the “Baseline” values by default. But you can add your own columns such as BL2 Start and BL2 Finish. And if you want to create variance formula’s there’s also a few bloggers that help you out with that. Might I suggest Raphael Santos? He is an active blogger and has a few good posts about creating formula’s in MS Project.
Let me know if this answers your question,
Kind regards,
Erik van Hurck